According to the most recent report by the U.S Bureau of Labor Statistics, businesses posted nearly 7.6 million jobs at the beginning of 2019, indicating a shift within the labor market. Despite this, there are currently around 1 million more open jobs than there are unemployed workers.
Interestingly, however, the unemployment rate remains unchanged at 3.8 percent as of March 2019, with the number of unemployed people in the U.S. equating to around 6.2 million.
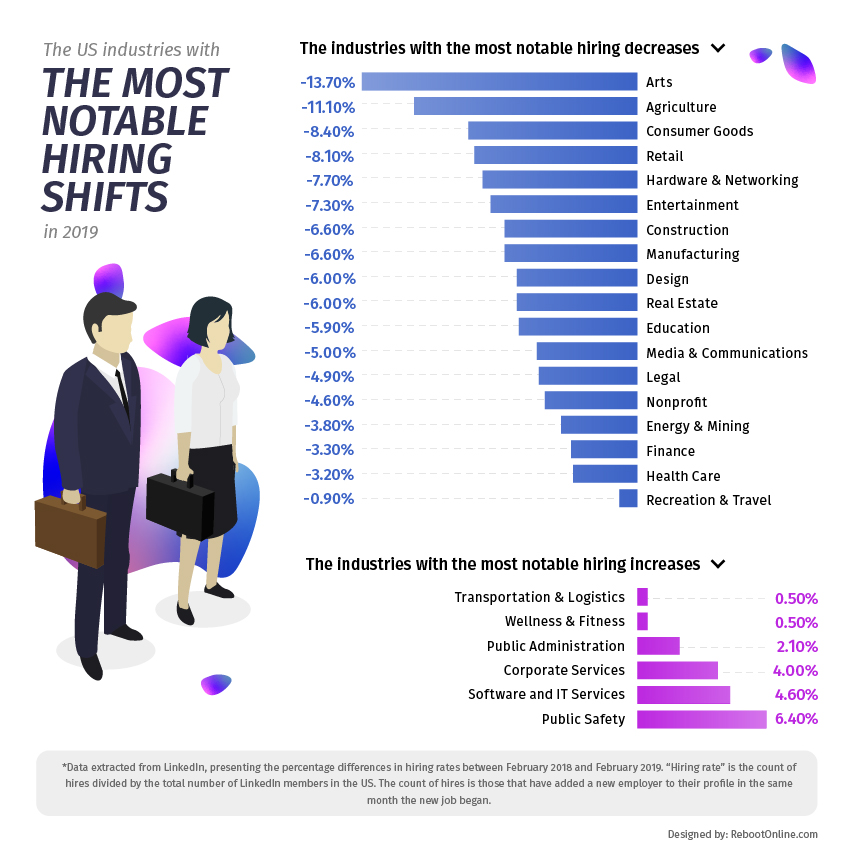
To explore the subject further, digital marketing agency Reboot Digital Marketing analyzed the latest findings in “The Workforce Report March 2019” by LinkedIn to further understand the industries with the largest hiring shifts over the last year.
According to the report, over 155 million U.S. workers have LinkedIn profiles, with over 3 million new jobs posted on the site every month. However, despite this, gross hiring across all U.S. industries was down 2.9 percent compared to February 2018.
Despite the evolution of technology, it seems the demand for more traditional/public service positions will not be disappearing anytime soon. Remarkably, a surprising industry that has seen the highest increase in hiring is public safety at +6.4 percent year-on-year.
Despite the substantial positive increase for this sector, both education and health care has seen a decrease in hiring, at -5.9 and -3.2 percent, respectively.
Ranking just behind public safety, Reboot Digital Marketing can also reveal that the next five industries that had the highest notable increases in hiring from February 2018 to February 2019 were:
- Software and I.T. services (+4.6 percent)
- Corporate services (+4 percent)
- Public administration (+2.1 percent)
- Wellness and fitness (+0.5 percent)
- Transportation and logistics (+0.5 percent)
At the other end of the scale, Reboot Digital Marketing found that the following 10 industries had the most notable decreases in hiring from 2018 to 2019:
- Arts (-13.7 percent)
- Agriculture (-11.1 percent)
- Consumer goods (-8.4 percent)
- Retail (-8.1 percent)
- Hardware and networking (-7.7 percent)
- Entertainment (-7.7 percent)
- Construction (-6.6 percent)
- Manufacturing (-6.6 percent)
- Design (-6 percent)
- Real estate (-6 percent)