You may have noticed recently that you’re going through a roll of paper towels at a faster clip or that there seem to be fewer tortilla chips in the bag. This isn’t your imagination. The concept is known as downsizing or shrinkflation. (We will use the term downsizing in this article.)
As input costs increase and costs to create a product rise, companies can increase the list price of a good or they can offer a smaller amount of the product for the same price. So, a candy bar’s size might change from 1.6 ounces to 1.5 ounces, yet the price stays the same. In other words, the price per unit the consumer pays increases as the amount they purchase decreases, while the price they pay at the register remains the same.
Downsizing is common across food and household commodities, including potato chips, paper towels, cereal, cleaning supplies, and candy. Manufacturers change sizes because market research indicates that consumers are more sensitive to price change than size change.1
Downsizing impacts the amount of a good a customer receives; therefore, goods that are sold by a specific unit of weight or volume do not experience downsizing. For example, gasoline or steaks generally do not experience downsizing as they are sold per gallon or per pound.
BLS makes every effort to capture the changes to product sizes and prices in the Consumer Price Index (CPI) in a timely manner. The CPI is a measure of the average change over time in the prices paid by the urban consumers for a market basket of material goods and services.
This Beyond the Numbers article examines product upsizing and downsizing and explores how these concepts affect measurements in the CPI. Read on to find out more about how the CPI captures these changes, which types of products experienced the most change between 2015-21, and its impact on inflation.
Product Size Change
Do you know how many sheets are on the roll of paper towels you bought or how many ounces of shampoo are in the bottle you usually use? Downsizing is sometimes hard to identify because manufacturers employ a variety of means to reduce package size while keeping the same price.
For example, they might add air to the package or increase the divot in the bottom of the jar. When manufacturers change the product size, they sometimes change the packaging colors, materials, or design. By combining size change with new package design, customers may perceive added value to the product experience and may not notice the difference in product amount. Product size change is also not universal within brands, sizes, or flavors. For instance, a manufacturer may downsize a bag of organic gummy bears from 4.5 oz. to 4 oz. while they keep the non-organic gummy bear bag the same size.
Products also experience upsizing, which occurs when a manufacturer increases the package size but keeps the price the same. This can be done to optimize package sizes, reverse a previously downsized item, or consolidate package sizes. Upsizing generally occurs less frequently than downsizing. Upsized products are sometimes advertised on the box as a "bonus buy" or "more for the money." Bonus buys are different from sale prices or buy one get one (BOGO) deals as product upsizing increases the amount of product in a container instead of selling it at a cheaper price or offering multiple units.
Downsizing And Upsizing In The CPI
Given how easy it is to miss downsizing when you are shopping, you might be wondering if the CPI is able to reflect these types of price changes accurately. The CPI strives to capture the price change caused by downsizing through accurate data collection and effective price calculations.
Our data collectors and economists identify changes to the goods and services used to calculate the CPI. Data collectors collect prices for the same unique set of goods and services over time. This includes identifying, verifying, and notifying each other of product size changes so the effective price change experienced by consumers can be accurately reflected in the CPI. When an item goes through downsizing or upsizing, the data collector reports the new data, updates the product description, and sends a message to economists in the national program office noting the product size change. Data collectors do not record information such as the number of chocolate chips in a cookie or the number of pepperonis on a pizza, however, they do record attributes such as weight and volume.
Our economists continuously review goods and services in the CPI. They identify product downsizing through monthly reviews of CPI data and online research. For products data collectors identify with a size or weight change, economists will conduct further research on the manufacturers’ websites, online shopping websites, and other sources to verify if the product is experiencing product downsizing or upsizing. Once the economist has verified that the item is experiencing product size change, they will notate the item and search the CPI sample for the same item. To ensure downsizing is captured in a timely manner, the economist will notify the data collectors that a product is experiencing downsizing so that they can be on the lookout for a size change.
Data collection procedures vary for different products and services; therefore, the impact of product size change is handled differently based on the item. An effective price per standard size, usually a price per ounce, is calculated for items where size is reported. The effective price per ounce is the collected price divided by size. For example, if a half-gallon (64 oz) of Brand A vanilla ice cream is priced in January 2021 at $5.99, then the effective price per ounce is $5.99 divided by 64 oz or $0.093 per ounce. If, in February 2021, the same Brand A vanilla ice cream is reduced in size to 60 oz, but the price is still $5.99, the effective price per ounce would be $0.0998 per ounce. This results in a 6.7 percent increase in the price per ounce of the ice cream, and the CPI would include this price increase. Our economists even adjust for items that do not have a weight, like toilet paper. For example, when the number of sheets per toilet paper roll changes from 220 per roll to 200, the economist will adjust the data to show a 10 percent price-per-sheet increase.
CPI economists track identified downsizing and upsizing in the CPI sample each month. Chart 1 displays the item categories with the most downsized and upsized observations in the CPI sample from January 2015 to December 2021. Household paper products experienced upsizing and downsizing more than any other category in the sample with 716 total reports during 2015–21. While that sounds substantial, it is only about 3 percent of the price observations for that category during the 7-year period. Snacks experienced the largest number of size changes for food items, with a total of 509, followed by sweetrolls, coffee cake, and donuts, tea and pies, tarts, and turnovers. For food items, 2.9 percent of observed prices experienced downsizing and upsizing.
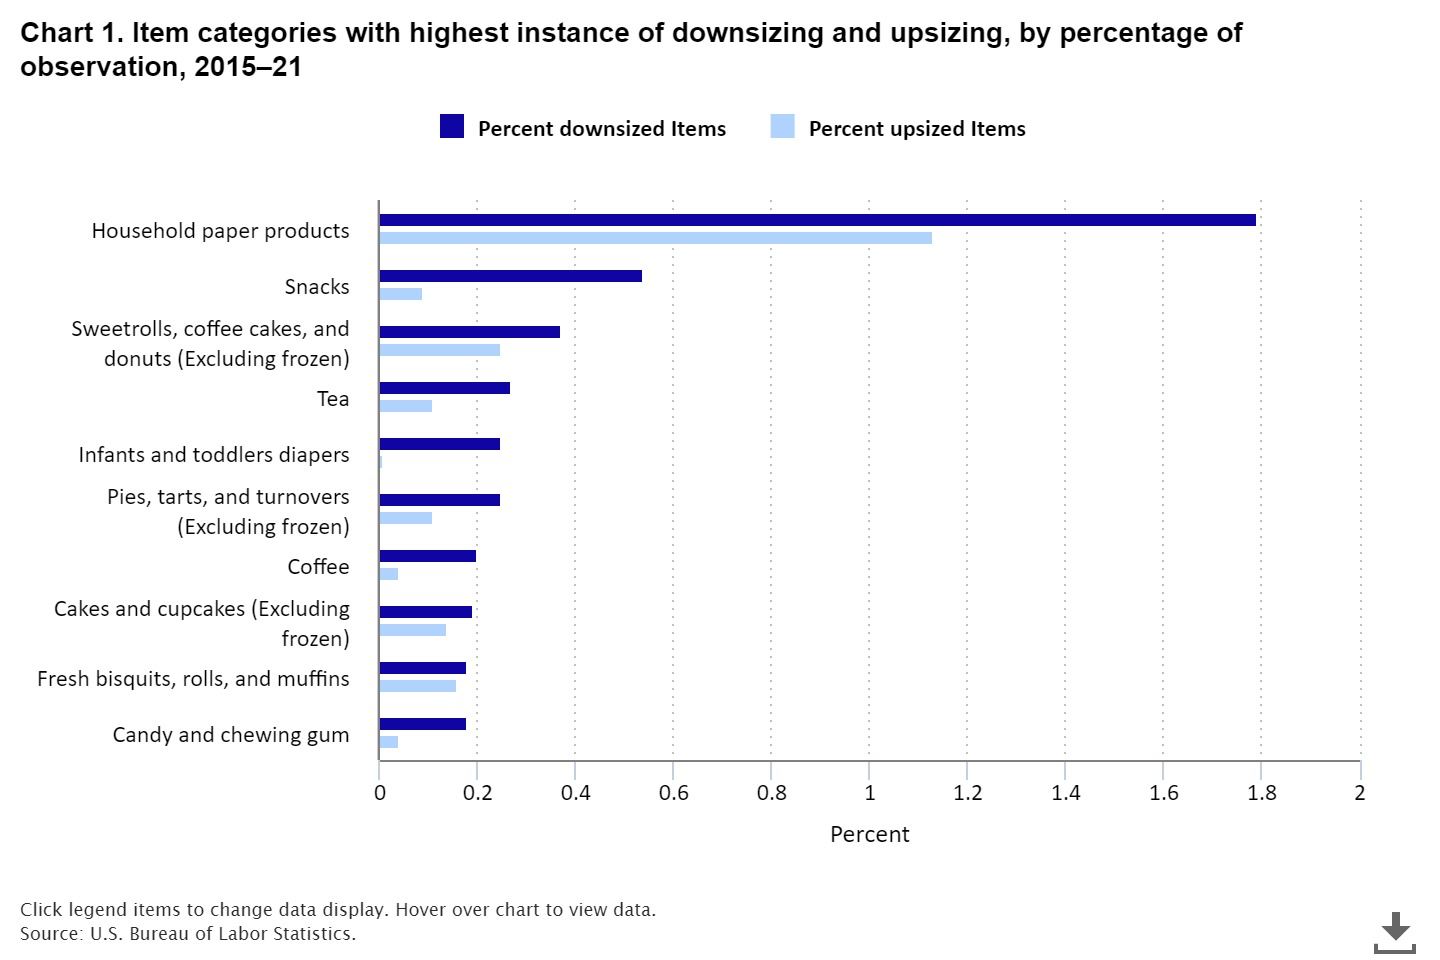
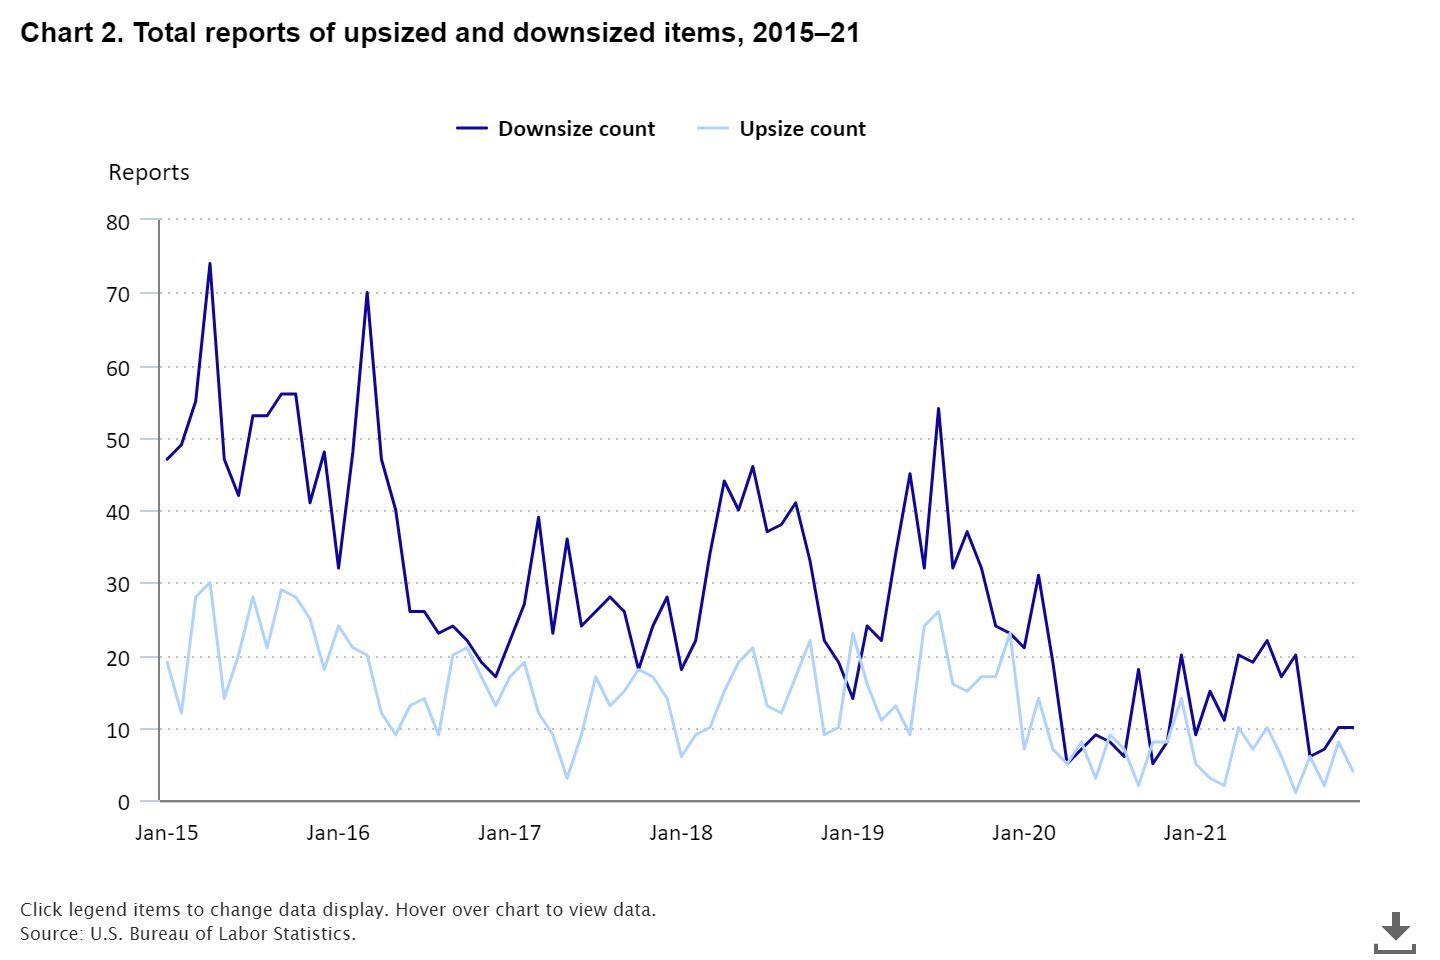
Chart 2 shows the total reports of upsized and downsized items for each month in the CPI sample from 2015-21. For context, there are approximately 100,000 goods and services priced each month in the CPI. Early 2015 and 2016 observed the highest number of reports for downsized items. During that time, potato chips, baby food, and paper towels saw a significant amount of downsizing.
Index Impact
So, how do these price changes hidden as size changes affect inflation estimates? They don’t have much effect on overall inflation but read on to see how we know that. BLS created a series of research indexes to analyze the impact of downsizing and upsizing in the CPI from January 2015 to December 2019. These research indexes were calculated by overriding price changes caused by upsizing or downsizing, and both research and CPI indexes were rebased to December 2014 and compared. BLS expected the CPI indexes to have higher index values than research indexes, as the price increase through downsizing is removed from the research index. While downsizing has an impact on individual items, it has miniscule impact on overall inflation.
The research indexes show small differences for the major groups and the CPI index for all commodity and services (C&S), which includes all items in the consumer price index except rent and owners’ equivalent rent of residences. (See chart 3.) The food and beverage lower level indexes show the largest changes between research indexes and the published CPI.
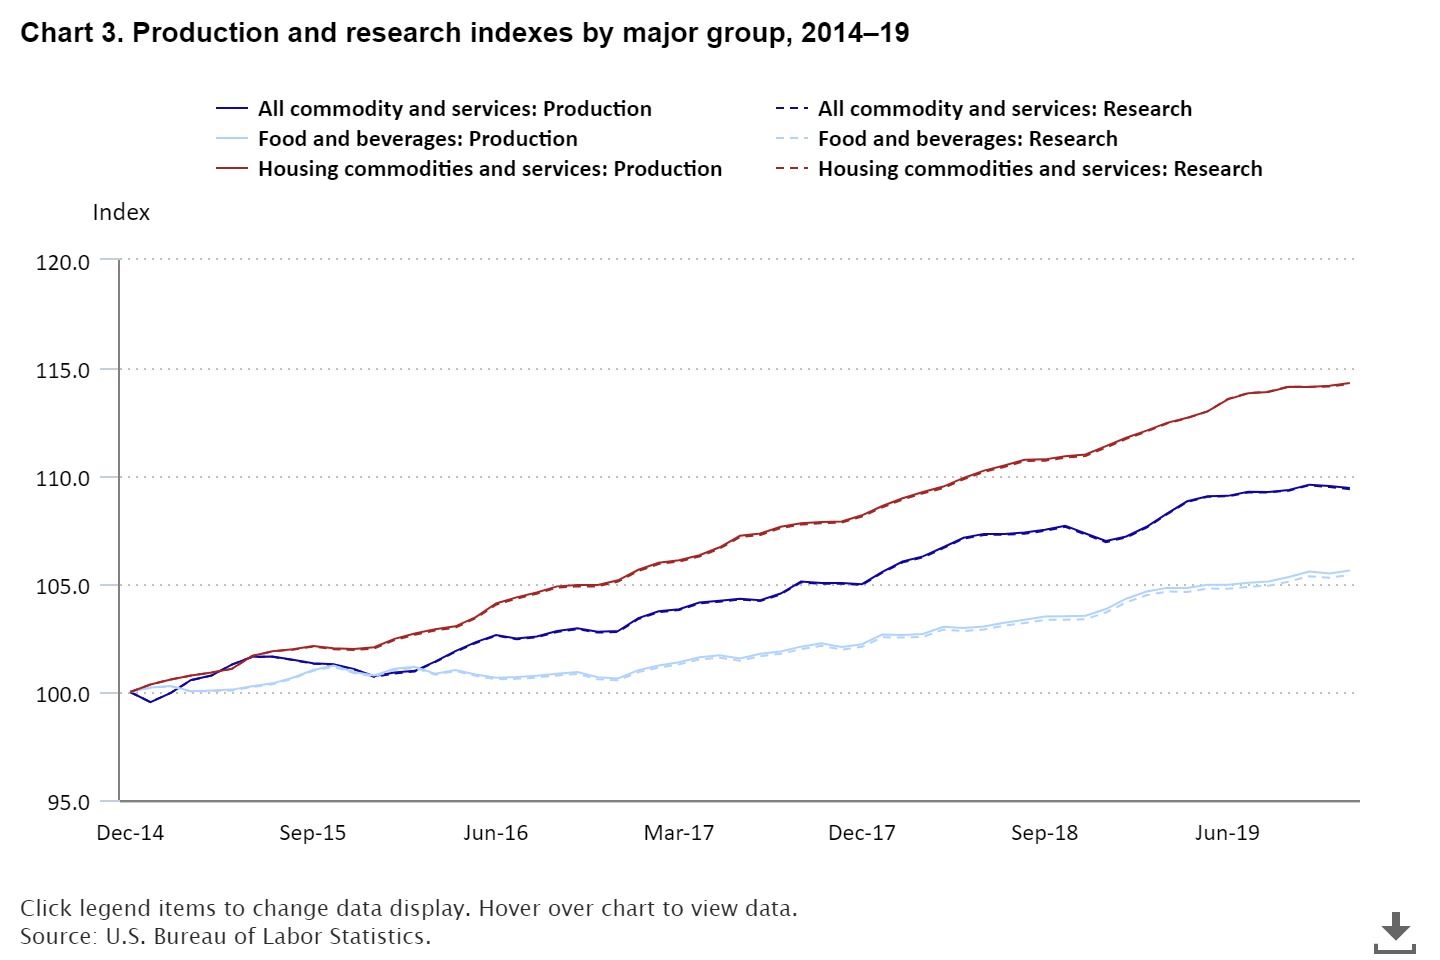
Table 1 displays the total index difference between the published CPI and the research indexes for all the commodity and services index and for the eight major groups in the CPI from 2015-19. The all commodity and services index shows a total difference between the published CPI and the research index of 0.05 percent over 5 years, which indicates that product size changes (upsizing and downsizing) increased the CPI all commodity and services index by 0.01 percent per year. The food and beverages index showed the largest difference (+0.21 percent), followed by housing (+0.05 percent) and other goods and services (+0.02 percent). The indexes for apparel, education and communication, medical care, recreation, and transportation showed no difference at the major group level.
|
Table 1. Production and research indexes change for major groups, by percentage, 2015–19
|
|
Commodity and services major groups
|
Production index total percent change, 2015–19
|
Research index total percent change 2015–19
|
Difference between research and production
|
Average difference per year
|
|
All Commodity and services
|
9.44
|
9.39
|
-0.05
|
-0.01
|
|
Apparel
|
-3.90
|
-3.90
|
0.00
|
0.00
|
|
Education and communication
|
1.04
|
1.04
|
0.00
|
0.00
|
|
Food and beverages
|
5.63
|
5.42
|
-0.21
|
-0.04
|
|
Other goods and services
|
10.90
|
10.88
|
-0.02
|
-0.00
|
|
Housing commodities and services
|
14.31
|
14.26
|
-0.05
|
-0.01
|
|
Medical care
|
15.91
|
15.91
|
0.00
|
0.00
|
|
Recreation
|
5.81
|
5.81
|
0.00
|
0.00
|
|
Transportation
|
4.36
|
4.36
|
0.00
|
0.00
|
|
Source: U.S. Bureau of Labor Statistics.
|
Table 2 focuses on the indexes where downsizing and upsizing significantly impacted item categories. Indexes that experienced the largest price increase due to downsizing were baby food (+2.81 percent); snacks (+2.64 percent); fresh biscuits, rolls, muffins (+1.59 percent); candy and chewing gum (+1.35 percent), and household paper products (+1.30 percent). Snacks, such as potato chips, saw frequent downsizing of their snack packs from 4.5 oz. to 4.25 oz. and an 8 oz. bag declining to 7.5 oz. Conversely, canned fruits and vegetables saw an increase in the research index as the effective price decrease due to upsizing was removed from the research indexes. The average total difference across all categories during the time period was 0.08 percent.
|
Table 2. Item categories with the largest effect of downsizing, by percentage, 2015–19
|
|
Item categories
|
Production index total percent change, 2015–19
|
Research index total percent change, 2015–19
|
Difference between research and production
|
|
Baby food
|
8.09
|
5.27
|
-2.82
|
|
Snacks
|
0.55
|
-2.09
|
-2.64
|
|
Fresh biscuits, rolls, and muffins
|
3.41
|
1.82
|
-1.59
|
|
Household paper products
|
5.56
|
4.35
|
-1.21
|
|
Household cleaning products
|
1.52
|
0.85
|
-0.67
|
|
Canned fruits and vegetables
|
1.45
|
2.71
|
1.26
|
|
Uncooked ground beef
|
-7.12
|
-6.49
|
0.63
|
|
Source: U.S. Bureau of Labor Statistics.
|
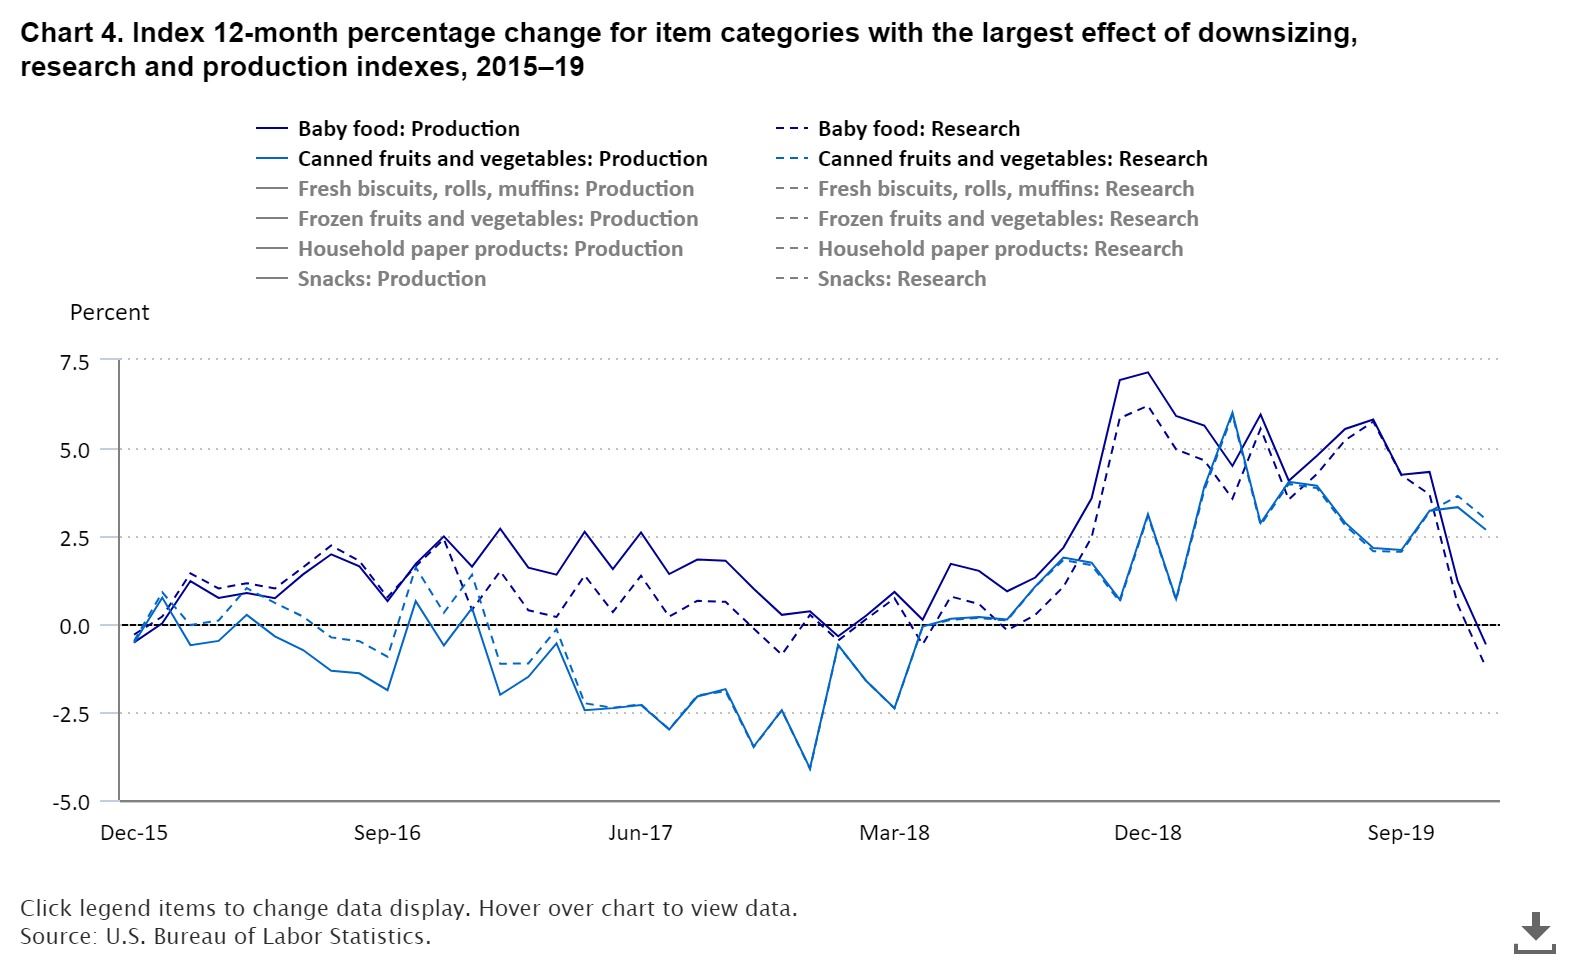
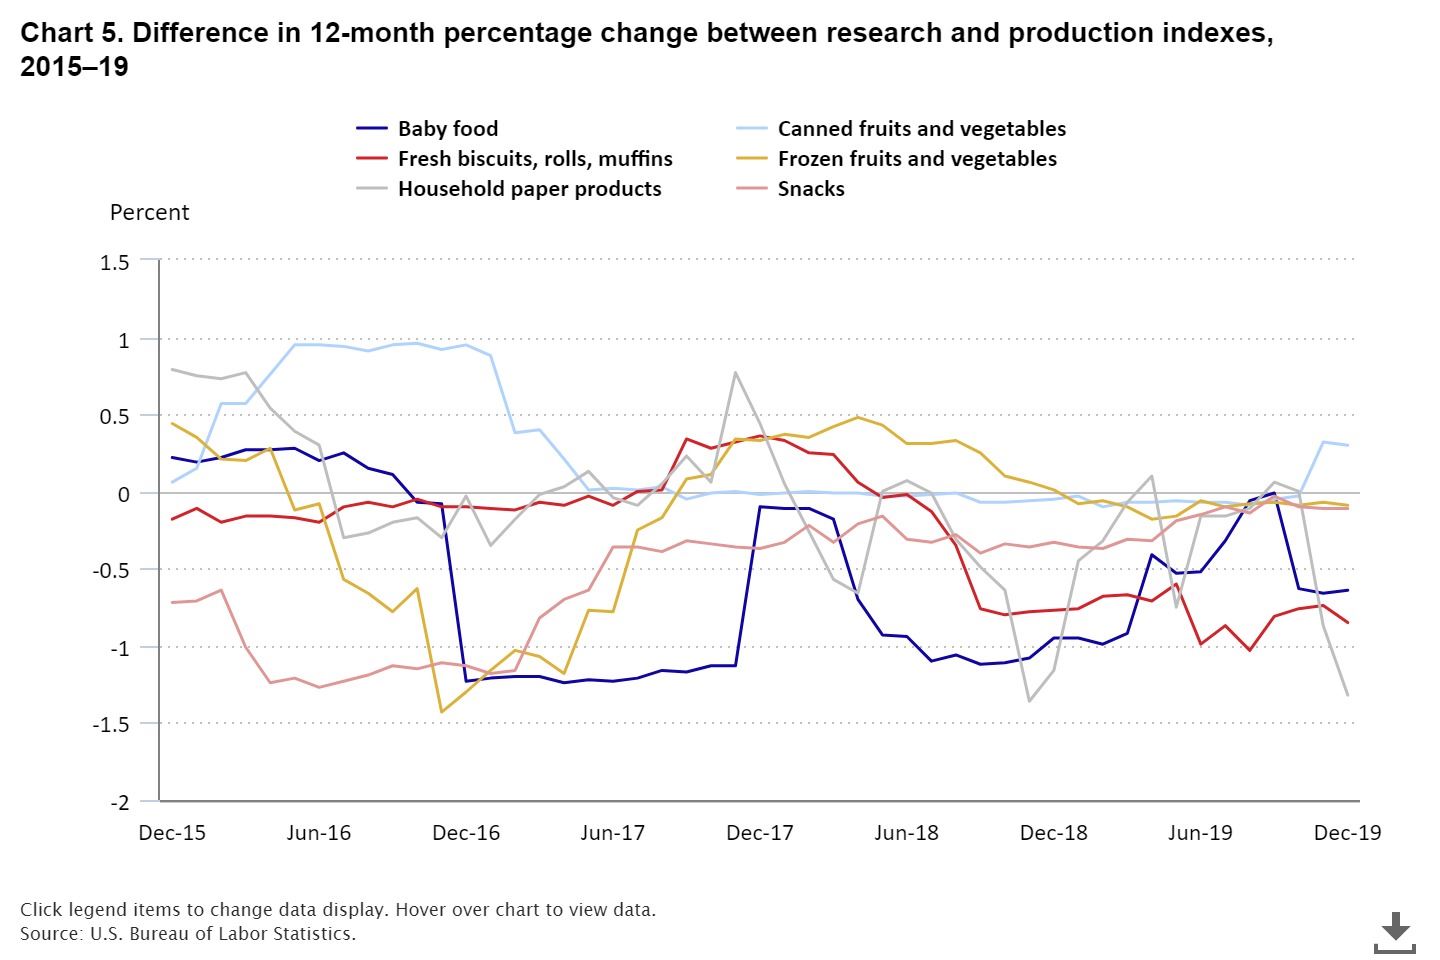
Charts 4 and 5 show the 12-month percent change for lower-level item categories with the largest difference between research and published CPI indexes. Canned fruits and vegetables experienced a decrease in price as products experienced upsizing from January 2016 through May 2016. Baby food experienced three periods of downsizing in December 2016, April–June 2018, and October 2019. Fresh biscuits, rolls, and muffins saw most of its products upsizing in September 2017 and downsizing in October 2018 and July 2019.
Conclusion
BLS strives to capture product upsizing and downsizing in the CPI in a timely manner. Product downsizing and upsizing affect the cost to consumers of goods and services. The effective price changes due to size changes are reflected in the CPI. This analysis indicates that while only a small number of prices in the CPI experience downsizing each year, it does affect the indexes for specific item categories where such size reductions are common. However, the impact of product downsizing at the all commodity and services level is minimal, with an average annual effect of 0.01 percent per year, so while consumers may notice shrinkflation at the grocery store, it has a very small impact the overall inflation picture they face.
Appendix
Tables A and B provide time period updates to table 2 from the February 2023 Beyond the Numbers article. The estimates of the effect of upsizing and downsizing in table A and table B are based on the same methodology described in the article but are calculated for the more recent time period of January 2019 through October 2023.
|
Table A. Item categories with the largest effect of downsizing in 2019–23, by percentage, results for January 2019–October 2023
|
|
Item
|
Production index total percent change, January 2019–October 2023
|
Research index total percent change, January 2019–October 2023
|
Difference between research and production
|
|
Household paper products
|
34.9
|
31.2
|
-3.6
|
|
Snacks
|
26.4
|
23.9
|
-2.6
|
|
Candy and chewing gum
|
29.7
|
27.7
|
-2.1
|
|
Household cleaning products
|
24.5
|
22.7
|
-1.8
|
|
Coffee
|
22.0
|
20.5
|
-1.6
|
|
Sugar and artificial sweeteners
|
44.5
|
43.0
|
-1.5
|
|
Ice cream and related products
|
21.4
|
20.0
|
-1.5
|
|
Fresh biscuits, rolls, and muffins
|
28.1
|
26.8
|
-1.3
|
|
Other processed fruits and vegetables including dried
|
23.7
|
22.4
|
-1.3
|
|
Frozen prepared foods
|
29.3
|
28.1
|
-1.2
|
|
Source: U.S. Bureau of Labor Statistics.
|
|
Table B. Item categories with the largest effect of downsizing in 2015–19, by percentage, results for January 2019–October 2023
|
|
Item
|
Production index total percent change, January 2019–October 2023
|
Research index total percent change, January 2019–October 2023
|
Difference between research and production
|
|
Baby food
|
32.7
|
32.0
|
-0.8
|
|
Snacks
|
26.4
|
23.9
|
-2.6
|
|
Fresh biscuits, rolls, and muffins
|
28.1
|
26.8
|
-1.3
|
|
Household paper products
|
34.9
|
31.2
|
-3.6
|
|
Household cleaning products
|
24.5
|
22.6
|
-1.8
|
|
Canned fruits and vegetables
|
35.7
|
35.8
|
0.1
|
|
Uncooked ground beef
|
34.9
|
34.9
|
0.0
|
|
Source: U.S. Bureau of Labor Statistics.
|
Notes
[1] See, John T Gourville. and Jonathan J Koehler, “Downsizing Price Increases: A Greater Sensitivity to Price than Quantity” in Consumer Markets (January 2004). HBS Marketing Research Paper No. 04-01. Available at SSRN: https://ssrn.com/abstract=559482 or http://dx.doi.org/10.2139/ssrn.559482.